
Application monitoring services watch the business software you depend on, such as your line-of-business app, customer portal, cloud suite or custom software. They alert someone when speed, errors or availability slip, and they help find the cause before staff or customers notice. For a small or mid-sized business, the real question is not which dashboard to buy. It is who watches the alerts at 2 a.m., who fixes what they find, and how that fits with the rest of your IT.
TL;DR
- Application monitoring tracks how software behaves (response time, errors, throughput, resource use) so problems are caught early, not reported by users.
- “Application performance monitoring” usually means the tooling. A monitoring service adds people who configure it, read it and act on it.
- Look for metrics, events, logs and traces in one view, useful alerts, dashboards your team will actually open, and clear access controls.
- Hybrid setups (some cloud, some on-premises) need a plan for what gets centralized and what stays local.
- Choose by the incidents that cost you most, the applications that matter most and the effort your team can absorb.
Table of Contents
- What application monitoring services actually are
- What business application monitoring tracks
- Why it matters for uptime and continuity
- What a monitoring service should provide
- Cloud, on-premises and hybrid applications
- Security and privacy in monitoring
- How to choose an approach for your business
- Our perspective
- Where Techbleed fits
- Getting started: a practical first 30 days
- FAQ
- Sources
What application monitoring services actually are
The terms overlap, so it helps to separate them.
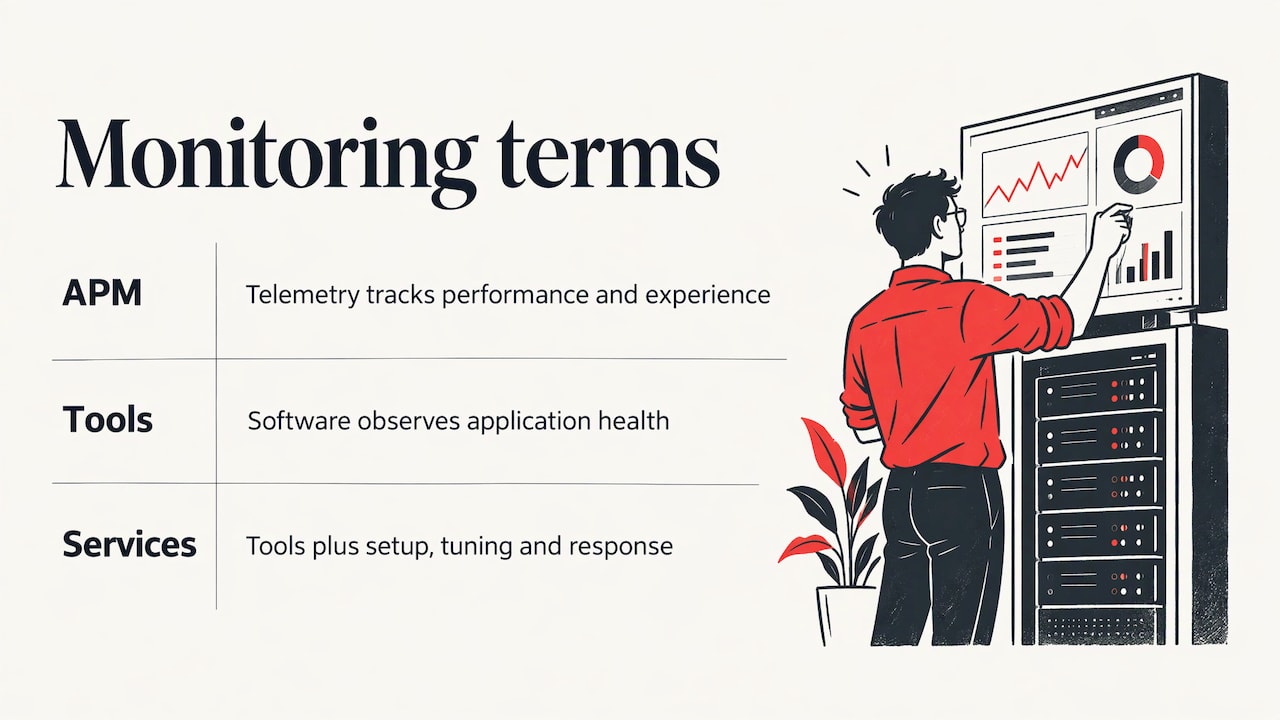
Application performance monitoring (APM) is the practice of using telemetry data and software tools to track an application’s performance in real time, pulling data from websites, mobile apps, servers, databases and third-party services so teams can tell whether things are running smoothly, as Splunk describes it. Google Cloud adds that APM goes beyond infrastructure-only monitoring into code, dependencies and user experience.
Application monitoring tools are the software itself. Gartner’s definition of the market covers software that lets teams observe and analyze application health, performance and user experience, and notes these products can be self-hosted, vendor-managed and hosted, or SaaS.
Application monitoring services are the tool plus the work around it: choosing what to measure, installing agents, tuning thresholds, watching alerts, investigating and fixing. Many APM offerings are third-party tools that help track application latency, trends over time, and SLAs and SLOs. Someone still has to decide what a good number looks like and respond when it is not.
That last part is where most small businesses get stuck. A tool without an owner produces alerts nobody reads. A service gives the tool an owner.
What business application monitoring tracks
Good monitoring answers three questions: is it up, is it fast, and is it correct. In practice that means a set of signals.
According to Google Cloud, typical signals include response time, throughput, error rates, CPU and memory use, network and disk I/O, requests, traces, logs and real-user page-load times. When a page-load metric is correlated with a distributed trace, log entries and error messages, teams can pinpoint causes and reduce mean time to repair (MTTR).
The scope can be wide. IBM notes monitoring can cover the full stack: application frameworks, operating systems, databases, APIs, middleware, web servers, user interfaces and supporting infrastructure. It also describes digital-experience monitoring, which measures load time, response time, uptime and downtime at the end-user device, commonly through real-user and synthetic monitoring.
Two terms worth knowing:
- Real-user monitoring records what actual people experience as they use the application.
- Synthetic monitoring runs scripted test transactions, such as logging in or checking out, on a schedule. It tells you something is broken even at midnight when no one is using it.
A simple way to read the numbers
The RED framework keeps dashboards readable: Rate (throughput), Errors (failures) and Duration (latency). SolarWinds gives examples of what a user-facing problem looks like: login errors rising from 0.1% to 5%, or checkout times going from 2 to 8 seconds. Neither number would take the application down, but both mean customers are already frustrated.
Why it matters for uptime and continuity
Monitoring is the early-warning layer of business continuity. AWS lists the practical gains: customer satisfaction, rapid diagnosis that keeps downtime to a minimum, resource optimization to reduce operating costs, and testing that uncovers errors before release. It can also track availability against service-level expectations and use synthetic traffic to find limits before users do.
Riverbed adds faster diagnosis and resolution, improved IT productivity and a unified view of the technology stack. AWS’s operational-excellence guidance goes a step further: telemetry is most useful when it is connected to business KPIs and user impact, not treated as infrastructure data in isolation.
For a law firm, that might mean tracking how long the document management system takes to open a matter. For a medical office, it could be the scheduling app’s login success rate. For a distributor, the order-entry screen’s error rate. The metric should be one someone in the business would recognize as a problem.
What a monitoring service should provide
Cisco DevNet says robust monitoring must collect, visualize and correlate metrics, events, logs and traces, which it calls MELT. Use that as the baseline, then check the rest of this list.
| Capability | What to expect | Why it matters |
|---|---|---|
| Telemetry collection | Metrics, events, logs and traces in one place | Lets you connect a slow page to the cause |
| Dashboards | Preconfigured views and dependency or flow maps | Shows what is affected at a glance |
| Alerting | Customizable thresholds plus anomaly detection | Catches problems fixed thresholds miss |
| Alert handling | Grouping, enrichment, routing, suppression, escalation | Prevents alert fatigue |
| Diagnostics | Transaction tracing and root-cause analysis | Shortens time to repair |
| Reporting | History, trends and service-level reporting | Supports reviews after incidents |
The capabilities in the table come from Cisco’s guidance on what to look for in monitoring tools and from ManageEngine’s APM requirements, which also lists end-to-end visibility across frontend, backend and API health, databases and dependencies, plus multi-channel notifications. Google Cloud names log management, error tracking, user-experience monitoring and infrastructure monitoring as the core components of a comprehensive solution.
Alerts that people act on
Alerting is where services separate from software. Cisco recommends grouping and enriching alerts with events, telemetry, runbooks and contacts, then using routing, suppression, prioritization and escalation. In plain terms: an alert should say what broke, who owns it and what to try first. If it only says “CPU high”, it will be ignored by week three.
Cisco also points to analytics such as mean time to repair, mean time to acknowledge and service-level objectives. These give you a way to review incidents and show whether things are improving.
Cloud, on-premises and hybrid applications
Most small businesses run a mix: Microsoft 365 or Google Workspace in the cloud, an accounting or practice-management package on a local server, and perhaps a custom app that touches both. Monitoring has to cover all of it.
Google Cloud’s architecture guidance for hybrid environments suggests two patterns: centralize monitoring and logging for a shared view, or keep sensitive application data on premises while exporting less-sensitive system data. That is a practical rule for regulated businesses: centralize what benefits from shared analysis, keep sensitive telemetry local.
Microsoft’s reference architecture shows how this works in practice: agents on on-premises, Azure and third-party-cloud workloads send logs and metrics to workspaces, which provide application maps, dashboards, alerts and automation runbooks. Oracle describes on-premises databases and applications feeding cloud observability services through REST APIs or a management agent.
You do not need to design this yourself. You need a provider who maps your applications, decides where each agent or check lives, and documents it.
Security and privacy in monitoring
Monitoring tools see a lot: user activity, transaction details, sometimes personal data. Treat the monitoring system as a sensitive system in its own right.
Things to confirm with any provider:
- Agent privileges. Elastic’s guidance suggests evaluating agent privileges, encryption between internal components, vendor certifications, third-party extensions, identity-management integration and role-based access control.
- Masking. AWS recommends masking sensitive information in logs, including personally identifiable information.
- Access controls. IBM recommends encryption, network and user access controls, firewalls, and monitoring of user activity and system logs when building security into monitoring.
- Data minimization. Privacy regulators’ telemetry guidance recommends transparency about what is collected, data minimization, pseudonymization or anonymization, and limited retention.
If your business handles client confidential data, such as a law firm does, security belongs in the same conversation as monitoring. Our law firm cybersecurity checklist covers the wider controls that sit around it.
How to choose an approach for your business
A growth-stage view is a useful way to think about it. One analysis frames it this way: early on you need uptime, errors and latency trends to debug incidents; as you grow you need tracing, release visibility and alerting discipline; at scale you need cost controls, sampling and ownership models. Not every business is a software startup, but the progression holds for companies whose applications are becoming more central.
Turn that into five questions:
- Which incidents are slowest to diagnose today? Start monitoring there.
- Which applications would hurt most if they stopped? Monitor those first, and define what “healthy” means for each.
- How much effort can your team absorb? If no one on staff can tune thresholds and respond to alerts, you want a service, not just a license.
- Which pricing variable will grow fastest? Some tools charge by host, some by data volume. Ask how the bill changes as you add users or applications.
- When will you outgrow this setup? Pick something that can expand without a rebuild.
A short worked example: a 40-person accounting firm relies on a hosted tax package, Microsoft 365 and a client portal built by a contractor. The portal is the only thing customers see, so it gets synthetic login and upload checks every few minutes. The tax package gets availability and response-time monitoring, since busy season makes slowness expensive. Microsoft 365 gets service-health and sign-in monitoring. Three applications, three levels of attention, one place to look.
Our perspective
Most of the monitoring problems we see are not tool problems. A business buys a product, turns on default alerts, and within a month the alerts are noise. Nobody owns them, nobody knows which ones matter, and the first real outage is still reported by an employee walking over to someone’s desk.
We think monitoring works best when it is part of day-to-day IT, not a separate project. That is why our clients get a dedicated point of contact who knows their applications, their busy periods and their people. When monitoring, support, security and backup are handled together, an alert about a slow application can be tied to the server, the network link or the cloud service behind it, and the person responding already knows the environment.
Our approach is proactive: we aim to prevent problems and keep operations running, with transparent planning so you know what is covered and why. If you run custom software, we can also build and support it, so the people who watch the application can work with the people who wrote it.
John
Where Techbleed fits
We provide IT services to small and mid-sized businesses in Glendale and the Greater Los Angeles area, and monitoring sits naturally inside that work. Our managed IT services give you a dedicated point of contact and proactive support, and our plans are laid out on the managed IT plans page (Essentials, Business and Secure).
Monitoring rarely stands alone. If your applications live in Microsoft 365, Google Workspace or virtual servers, our cloud computing services cover that side. If an outage would stop the business, business continuity services cover backup, disaster recovery, internet failover and power protection. And if the application itself is custom, our application development services mean the team that builds it can also support it. To talk through what to monitor first, start from techbleed.com.
Getting started: a practical first 30 days
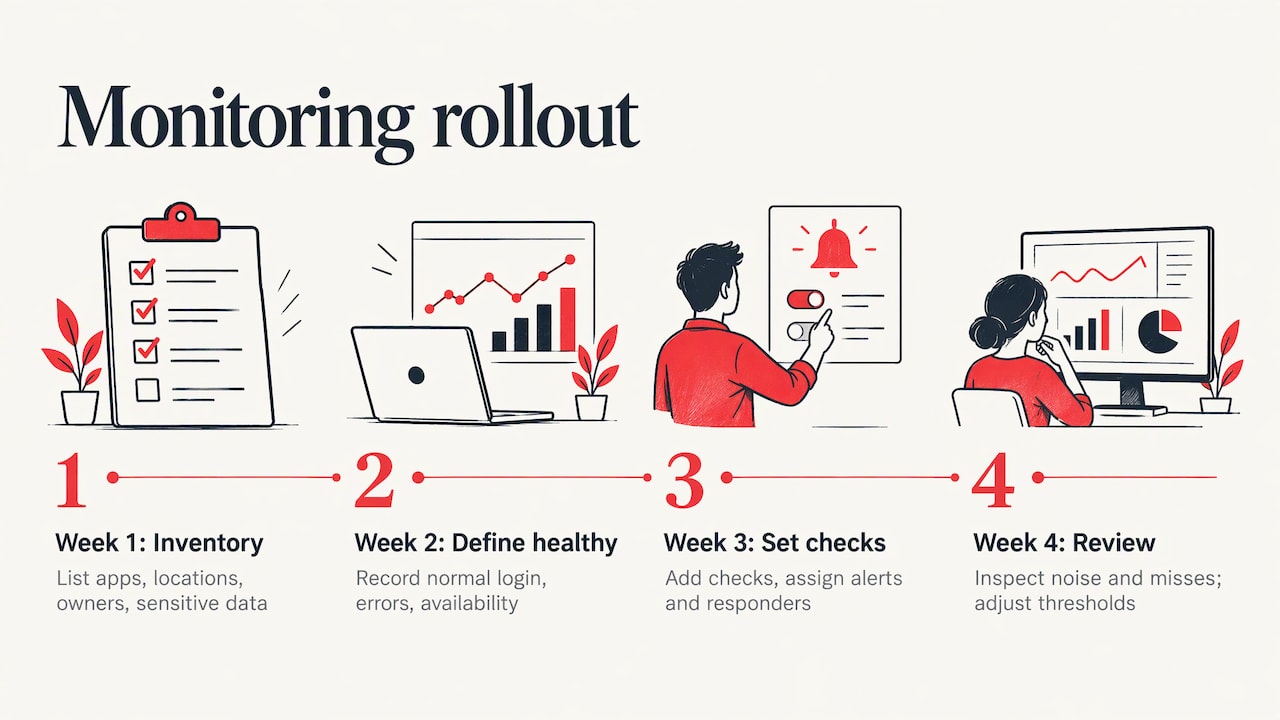
You do not need to monitor everything at once. A staged start is cheaper and teaches you what matters.
Week 1: inventory. List every application staff and customers use, where it runs (cloud, on-premises, vendor-hosted) and who owns it internally. Note which ones touch sensitive data.
Week 2: define healthy. For your top three applications, write down what normal looks like: typical login time, acceptable error rate, hours it must be available. Without a baseline, an alert is a guess. Cisco notes that tracking user-experienced load and response times during peak usage helps establish a performance baseline and identify possible bottlenecks.
Week 3: set up checks and alerts. Add availability and synthetic checks first, then metrics and logs. Decide who gets each alert, at what hours, and what they should do.
Week 4: review. Look at what fired, what was noise and what was missed. Adjust thresholds. Repeat monthly, because applications and usage change.
FAQ
What is the difference between application monitoring and application performance monitoring?
The two terms are used almost interchangeably. Application monitoring is the broader idea of watching availability, errors and behavior. Application performance monitoring emphasizes speed and user experience, using telemetry such as traces and response times to find root causes. In practice, most services cover both.
Do small businesses need application monitoring?
If staff or customers rely on an application for revenue or daily work, yes. You do not need an enterprise setup. Start with availability checks and error tracking on the two or three applications that would hurt most if they failed, and add depth as you grow.
Can monitoring cover both cloud and on-premises applications?
Yes. Agents or APIs can send data from on-premises systems and cloud services into a shared view. Where data is sensitive, you can keep detailed telemetry local and send only summary or system-level data to a central dashboard.
Who responds when an alert fires?
That depends on how the service is set up, and it is worth settling before you sign anything. Decide who is notified, during which hours, and what they are expected to do. With managed IT, your dedicated contact and support team typically handle that response alongside the rest of your IT.
Is monitoring a security measure?
It supports security, since unusual behavior in an application can be an early sign of trouble, but it does not replace security controls. Pair it with access management, patching, backups and email protection, and secure the monitoring system itself.
Sources
- What Is APM? Application Performance Monitoring, Explained (Splunk)
- What is application performance monitoring (APM)? (Google Cloud)
- Magic Quadrant for Application Performance Monitoring and Observability (Gartner reprint)
- What is an APM Service? (New Relic)
- Application Monitoring Best Practices (IBM)
- Application Performance Monitoring: Best Practices Guide (SolarWinds)
- What is APM? (AWS)
- Application Monitoring Explained (Riverbed)
- OPS04-BP02 Implement application telemetry (AWS Well-Architected)
- What to Look for in Application Performance Monitoring Tools (Cisco DevNet)
- What to Look for in Application Performance Monitoring Tools, overview (Cisco DevNet)
- Application Performance Monitoring (APM) Requirements (ManageEngine)
- Hybrid and multicloud monitoring and logging patterns (Google Cloud)
- Monitor hybrid availability and performance (Microsoft Azure)
- OCI Observability and Management checklist (Oracle)
- An Introduction to APM (Elastic)
- IWGDPT Berlin Group Working Paper on Telemetry and Diagnostic Data
- APM for Startups: Tools, Costs, and Tradeoffs
- What is APM? Application Performance Management (Cisco)
Recommended
- How to Choose a Managed IT Service Provider
- What Is Included in Managed IT Services?
- Managed IT Pricing: Compare Plans
- What Are Managed IT Services?
Created with BabyLoveGrowth technology